We are hearing a lot about November 14th G20 meeting in Washington. Many are saying that it'll be Bretton Woods II. You can check out interesting article on it on
Bloomberg. Main focus of this meeting will be stimulating World Financial System & some talk on shifting of power .
Since short term focus is about stimulating the world financial system, I am expecting short term bull on global equity market. Longer term of global stock market will be decided by steps taken in meeting for more regulations.
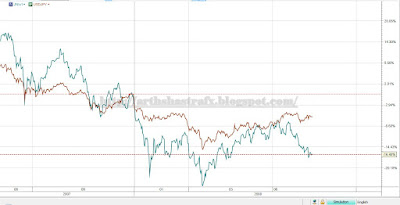
These are USDJPY & S&P500 comparative charts.


S&P 500 daily channel pattern is very simmilar to current USDJPY daily channel pattern.
Therefore, if the pattern is right on
bear side than will see USDJPY near 85 and S&P500 in lower 800's.
But if, USDJPY goes back to correction
bull side on upper channel line in it's 105 level, then will surely see S&P 500 to 1100 level.
Many Wall Streeters have predicted that we have hit the bottom on S&P500 & many are saying that worst is yet to come, but I am still expecting more strenghning of JPY over the long run, because demand of Japanese Exports has slowed down tremendously .
Now, let's look @ short term charts of these two pairs.


Short Term charts are clearly showing bullish chart patterns. And we also know that expansion of credits will rally the market for shorter term. Recently China pumped money into system; interest rates are being lowered in G20 nations rapidly; World Bank is also pumping money. The key thing will be to know what decisions are being taken ub November 14th meeting other than pumping money into system.
After pumping $200 billion by central banks around the globe + Fed's bailing out role of AIG, MER-BOA, GS, JP Morgan things, market should calm down at least for a while. I am expecting new buyers to kick in & SPX should go back up near 1300 until next big news comes out.
Crude oil is down & there is temporary enough liquidity in market. Fed & other central banks are really committed to continue their
Term Auction Facility program to pump up money. So, I am not seeing any other reasons right now for SPX, not to go back 1300 in coming months.

That means, USD/JPY back to previous key level of 108-109.
EUR/USD should remain in pressure due to ECB's dovishness towards interest rate. Check
previous post on currency analysis for detail fundamental view.
I'll be watching Gold really carefully becase in India key festival season
(Diwali) of the year is coming next month. India is the
largest consumer of Gold. If consumer demand increases for gold for the season more than expected than surely there'll temporary rise on AUD & EUR, but rise would be really limited.
So, let's keep watching volume & open interest and make some money.
Happy trading.


 Last week
, I had said that I am bearish on SPX & my
medium term targets were already posted before that. Market came close to last low of 1200, but it failed to make double bottom pattern on medium term.
Before SPX started going down this WEEK, TNX was already making big bearish candles & JPY had already started showing bullish signs against Dollar as well as GBP, EUR & AUD. So, it was a very clear signal that drop on SPX was coming. I told many of you on Wednesday about it.
I'll post update on charts once market close today & after I get all volume & open interest detail.
From now on I am not gonna do biweekly analysis of market like usual, only weekly analysis. I am getting none to very little feedback. So if you interested in daily or biweekly analysis, email me. I'll respond it.
Later u all....
"The Securities and Exchange Commission may let large U.S. companies switch to international accounting rules in six years, a step it says will lower compliance costs and make American firms more competitive.
SEC commissioners today approved a ``road map'' that might allow corporations with market values exceeding $700 million to abandon U.S. accounting standards by 2014. Under the plan, about 110 U.S. companies that are global leaders in their industries may move to international rules as soon as 2010.
``A global set of high-quality accounting standards would be an international language of disclosure, transparency and comparability,'' SEC Chairman Christopher Cox said at an open meeting in Washington. ``It's a goal worth pursuing.''
Meshing U.S. regulations with rules adopted by other countries is a priority for the agency, which has said companies will be able to reduce expenses by eliminating duplicate accounting. Investors will benefit because they ultimately bear the burden of higher compliance costs, SEC officials argue.
Critics, such as U.S. Senator Jack Reed, a Rhode Island Democrat who heads a subcommittee that oversees the SEC, have said the agency may put investors at risk by outsourcing its oversight to less-aggressive regulators......."
more via BLOOMBERG http://www.bloomberg.com/avp/avp.htm?clipSRC=mms://media2.bloomberg.com/cache/vnSDDezhP0rc.asfNote: BE CAREFUL BUYING SOME STOCKS OF BIG CAPS TO SMALL CAPS.
New Text Books should be written on Accounting, Market Analysis for Public Schools. What Public Schools teach & where MARKET is going, they don't match...


10 Year Treasury Note has failed to maintain its bullishness on daily time frame. That means bearish SPX & bearish USD/JPY. US Dollar is extreme over bought in short term & Gold is over sold with Crude Oil. I am watching AUD very closely for Gold. If RBA lowers interest rate despite of higher inflation in Australia, it'll effect Gold price uniquely. We'll see how much AUD goes off the correlation with Gold then.

SPX has made false break out speaking from Rising Wedge Pattern. Now, it is more clearer by looking at TNX charts that it's continue bearish trend since doji has failed to reverse trend as I had
mentioned in August 10th post. I have already posted my bearish target levels for SPX in that post.
On the other hand, JPY has gained sharply today against US Dollar as well as EUR, GBP & AUD. I am bearish on USD/JPY as many of you know. I posted detailed chart analysis of USD/JPY on
August 7th. I still stand for that. :) Below here is the current chart of USD/JPY(daily). As you can see there is some Rising Wedge Pattern here as well. If rising wedge pattern analysis is true, then big drop is coming soon on both SPX & USD/JPY, but for that TNX has to break downward current trend as well. So, keep watching all three.

Happy Trading......
BEAR ARGUMENT
I have Rising Wedge (Bearish) Pattern in 360 minutes chart. To support this bearish pattern argument, these are
tons of other bearish rising wedge patterns.

This is 60 minutes SPX chart. It is hitting currently @ important trendline & there is a higher probability of reversal from here.
BULL ARGUMENT
This is 10 Year Treasury Yield chart. Bullish TNX means bullish SPX.
Conclusion:
I have both bull & bear sides speaking from technical analysis.
Georgia-Russia war might push price of crude oil high and fear of US-Russia war also plays a role indirectly since Georgian Troops are trained by US-British Army.

In this SPX chart, we are seeing main bearish trend, but it's going for small correction. 1290(tripple top) is major level to break upward. I am watching small triangle pattern very closely, because it can break any side. To look @ bull or bear sentiment for SPX, I would look @ TNX & USDJPY. Follow TNX & USDJPY chart below.

In post of
August 5th this week, I had mentioned that TNX will test 41 atleast, if not higher. In past two days it did. It is also sitting on important level of making or breaking. TNX analysis is very important for SPX & JPY traders. They all go in same direction with above 85% correlation.
There is a medium term bearish thick blue line trend & dotted long term bullish trend. If it breaks below, then SPX is surely going down. Reversal is also true as well. Keep watching......

USD/JPY... This is very interesting chart of all to me. Current price level is sitting at two important trend line crossover. Despite of today evening's big fall in EUR, AUD & CHF, JPY hasn't dropped that much @ all. SPX & NIKKEI were down and same time EUR & CHF were bearish too. Therefore it made USDJPY more sideways then bullish. With further fall of SPX & 10 year Treasury Yield, USD/JPY will be bearish.

The reason I put USDCHF here is because of it's very strong correlation to JPY & TNX. As you see here, it's also sitting at very important level of break or reverse.
CONCLUSION:Very important to watch market tmrw or next week. Stay alert....
I'll be placing more JPY trades next week based on this analysis for Carry or non-carry.
Many of you know that I am watching Crude Oil very closely to trade USDJPY.
In post of
July 17th about Crude Support Levels, I had mentioned that crude more likely to have technical support @ upper 120s, & so it did if you analyze it with current chart. Next support lies @ near
110.

But USDJPY hasn't broken the 108.50 level which is very key resistance level @ this point. If we look @ 108 resistance level's past two histories, it shows that JPY has always strengthened after testing @ 108 as resistance.

So, what does it mean for SPX?
Since we know that SPX is in retrace mood from yesterday closing to test back 1290 for short term, I am not planning to trade USD/JPY. Because I am expecting USD/JPY to be traded on sideways. I'll trade USD/JPY long or short when all bull or bear matches togather. For right now, NO USD/JPY trade.

SPX finishes 1284 short term target level as mentioned in
July 17th, 08 &
July 16th, 08 post. Right now according to Fibonacci, it's in the consolidation zone. But there is a higher possibility that it may extend it's gain near 1290 where some resistance rests.


This chart has 1 year high-low projected Fibonacci Resistance. Level 23.6 which is minimum pull back is @ 1282 which closely matches with
last extreme high-low fibonacci analysis done in previous post at 38.2 level on 1284. So it's very high probability that SPX is atleast going to 128- level.
Second chart is about % ratio analysis between Dollar Index(blue), USD/JPY(Black), SPX(Brown) for short term. Since there was a clear divergence between USD/JPY & SPX we knew that SPX has to follow trend of USD/JPY. I am not expecting USD/JPY to break thick blue (ver strong support, level 108)horizontal line, due to strong bearish fundamentals on USD & market expectation of Bank of Japan to raise interest rate soon.

Possibility 1:
USD/JPY stays @ purple trendline and reverses = SPX near 1276 & possible reversal
Possibility 2:
USD/JPY stays near blue horizontal (very strong) support line near 108 = SPX near 1290 & possible reversal.
Possibility 3:
USD/JPY stays near blue support line(108) & SPX goes near 1311 that will be strong reversal territory.
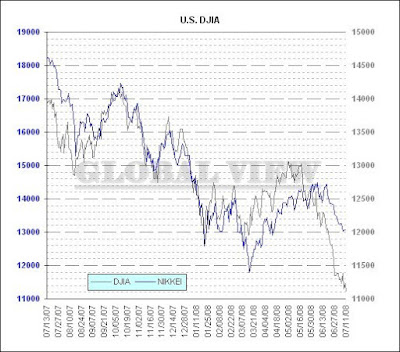
Many historians & economists believe that over the longer period of time nation's major stock market follows the trend of nation's currency; mainly these analysts are from Austrian School of Economics & some Monetarism believers. And history has proved times, they both go on 1:1 ratio.
So I thought let me look at current percentage ratio between SPX & Dollar index with combining Nikkei & USD/JPY.
In this chart, we are seeing that Nikkei closely follows USD/JPY, but situation is not same with Dollar Index with SPX. But in the past SPX had gone 1:1 with Dollar Index. The key analysis @ same time will be
JPY vs. Nikkei. USD/JPY has to fall near 95 in order to prove this theory. Long term technical analysis on SPX also says that it should fall near
1050. With so much
money supply, we already know that US Dollar is not going to recover soon.
Again, this is very long term 1:1 ratio theory beween SPX:US Dollar. But for right now, let's enjoy some rally. :)

Red: USD/JPY, Black:US Dollar Index, Green: Nikkei, Blue:SPX
As mentioned before, I am expecting pull back from target I had at
1200 with SPX. Also, as you see here, USD/JPY works like moving average for Nikkei. So I am expecting Nikkei to rise where USD/JPY is to make up the ratio. The correlation coefficient between Nikkei & SPX is more than 90%. That also means pull back on SPX comes atleast near 1250, then 1284 according to FIB levels. If SPX comes back & tests lower trendline from given levels & holds there, that will be 2nd stange of bull on SPX near 1350.
SPX

USD/JPY

SPX (Brown) vs. Nikkei(Blue) vs. USD/JPY(Black)

We are seeing in these two charts' analysis that Nikkei eventually meets USD/JPY. Currently correlation between these two is bit low, but eventually Nikkei will catch up with USD/JPY. So if we apply this correlation scenario with SPX vs. Nikkei vs. USD/JPY, I am seeing greenzone in SPX & Nikkei soon after correction to near 1200 on SPX.

From technical level, USDJPY is ready to move ahead near 110, unless something serious fundamental event comes up.

This Black chart was posted on http://bigpicture.typepad.com/ & he is calling for more downside on SPX.

This is VIX vs. SPX correlation(inverse) chart. Currently it is @ -0.613. The usual correlation between these two is above -0.90. So we are seeing divergence here. One of them is not priced right. And also, VIX is @ important resistance level right now speaking from trendline.

This Chart is USD/JPY spot 4hr. This pair is currenly in upward channel, but going for downside correction. So correlation of USD/JPY & SPX is giving indication for short term downward in SPX.
 RSS
RSS Twitter
 Facebook


