Alan Greenspan
Personally, I am really not a fan of Alan Greenspan. But..... We didn't have choice @ that time. I found this on one of my all time favorite blog- Big Picture.
Read this document on Scribd: Alan Greenspan- The Age of Turbulence pdf
AUD/USD
Click here to see July 16th Price & Trend Analysis for AUD/USD
Current AUD/USD daily time frame.
FNM × FRE
Did you notice "UNLIMITED CREDIT" here? That's a bad news for US Dollar for long term.
 Congressman Dr. Paul on Fannie Mae & Freddie Mac
SPX
SPX finishes 1284 short term target level as mentioned in July 17th, 08 & July 16th, 08 post. Right now according to Fibonacci, it's in the consolidation zone. But there is a higher possibility that it may extend it's gain near 1290 where some resistance rests.

EUR/CHF × USD/CHF
 USD/CHF target has achieved with +229 pips Gain: position closed.
Entry Position & Analysis from last Wednesday's post.
 EUR/CHF passes first initial target with +194 pips gain, half position closed.
Entry Position & analysis from last Wednesday's post.
US Dollar

One of my friend emailed me this morning with this funny, but sad picture of US Dollar.


SPX × US Dollar × US$ Index × USD/JPY
 This chart has 1 year high-low projected Fibonacci Resistance. Level 23.6 which is minimum pull back is @ 1282 which closely matches with last extreme high-low fibonacci analysis done in previous post at 38.2 level on 1284. So it's very high probability that SPX is atleast going to 128- level.
Second chart is about % ratio analysis between Dollar Index(blue), USD/JPY(Black), SPX(Brown) for short term. Since there was a clear divergence between USD/JPY & SPX we knew that SPX has to follow trend of USD/JPY. I am not expecting USD/JPY to break thick blue (ver strong support, level 108)horizontal line, due to strong bearish fundamentals on USD & market expectation of Bank of Japan to raise interest rate soon.
 Possibility 1:
USD/JPY stays @ purple trendline and reverses = SPX near 1276 & possible reversal
Possibility 2:
USD/JPY stays near blue horizontal (very strong) support line near 108 = SPX near 1290 & possible reversal.
Possibility 3:
USD/JPY stays near blue support line(108) & SPX goes near 1311 that will be strong reversal territory.
Crude Oil × Gold × Money Supply × US Dollar
 This is the chart of Crude Oil vs. Current Money Supply. (Isn't it astonishing chart?) The fact is excess of money supply causes price to rise and that is called inflation, not other way around.
One argues that but price didn't rise from mid 80's to late 2000 despite of increasing of money supply. But reply from Mr. Paul is not surprised. He says,"Amount of exploration in late 70's & 80's caused enormous amount of production capacity in oil by major oil companies & made oil cheap. The effect was Americans got used to very cheap oil."
Furthermore, by explaining this chart below where price of oil is adjusted by money supply by Federal Reserve he says that current price of oil should be near $3.00/barrel if there was no money supply from 1959-2008. From near $3 to $135 price hike is caused by money supply and from $0 to near $3 is caused by supply-demand.
 If one applies same money supply analysis with Gold, he/she shouldn't be surprised. Below here, chart of Gold from 1975 to 2008 completely matches with Oil & money supply. The difference is Oil rose faster than actual rate of inflation in parabolic pattern like gold did from 1979 to Jan 1982.
 So result will be, oil could make new support near $100, but it's not going down further. It's only going up in future because we are already observing free use of money supply by Fed. So, I am not surprised when some analysts saying that oil will be reaching to 200+ & same is true with Gold & Silver.
The good news is, when Fed raises interest rate like Paul Volker had to in mid 1980's, current profit of oil companies will worth more in Dollar terms & it'll help them to increase production capacity by increasing oil exploration. But it's not coming soon until we bottom in financials.
Nikkei × SPX × US Dollar × USD/JPY
Many historians & economists believe that over the longer period of time nation's major stock market follows the trend of nation's currency; mainly these analysts are from Austrian School of Economics & some Monetarism believers. And history has proved times, they both go on 1:1 ratio.
So I thought let me look at current percentage ratio between SPX & Dollar index with combining Nikkei & USD/JPY.
In this chart, we are seeing that Nikkei closely follows USD/JPY, but situation is not same with Dollar Index with SPX. But in the past SPX had gone 1:1 with Dollar Index. The key analysis @ same time will be JPY vs. Nikkei. USD/JPY has to fall near 95 in order to prove this theory. Long term technical analysis on SPX also says that it should fall near 1050. With so much money supply, we already know that US Dollar is not going to recover soon.
Again, this is very long term 1:1 ratio theory beween SPX:US Dollar. But for right now, let's enjoy some rally. :)
 Red: USD/JPY, Black:US Dollar Index, Green: Nikkei, Blue:SPX
Nikkei × SPX × USD/JPY
As mentioned before, I am expecting pull back from target I had at 1200 with SPX. Also, as you see here, USD/JPY works like moving average for Nikkei. So I am expecting Nikkei to rise where USD/JPY is to make up the ratio. The correlation coefficient between Nikkei & SPX is more than 90%. That also means pull back on SPX comes atleast near 1250, then 1284 according to FIB levels. If SPX comes back & tests lower trendline from given levels & holds there, that will be 2nd stange of bull on SPX near 1350.
SPX
 USD/JPY
 SPX (Brown) vs. Nikkei(Blue) vs. USD/JPY(Black)

SPX
 USD/JPY
 SPX (Brown) vs. Nikkei(Blue) vs. USD/JPY(Black)


Fed × FNM × FOMC × FRE × Peter Schiff
Ben Bernanke in 2002 on Money Supply
"Like gold, U.S. dollars have value only to the extent that they are strictly limited in supply. But the U.S. government has a technology, called a printing press (or, today, its electronic equivalent), that allows it to produce as many U.S. dollars as it wishes at essentially no cost. By increasing the number of U.S. dollars in circulation, or even by credibly threatening to do so, the U.S. government can also reduce the value of a dollar in terms of goods and services, which is equivalent to raising the prices in dollars of those goods and services. We conclude that, under a paper-money system, a determined government can always generate higher spending and hence positive inflation. "
On July 13, 2008
"The Board of Governors of the Federal Reserve System announced Sunday that it has granted the Federal Reserve Bank of New York the authority to lend to Fannie Mae and Freddie Mac should such lending prove necessary. Any lending would be at the primary credit rate and collateralized by U.S. government and federal agency securities. This authorization is intended to supplement the Treasury's existing lending authority and to help ensure the ability of Fannie Mae and Freddie Mac to promote the availability of home mortgage credit during a period of stress in financial markets."
FRB Press Release
From Marketwatch,
"At the moment, each company may borrow only $2.25 billion."
"But the agencies have grown to mammoth size. They own or guarantee $5.2 trillion of U.S. home mortgages. "
"Peter Schiff, president of Euro Pacific Capital, predicted that the package would put downside pressure on the dollar. He said letting the two firms collapse was preferable to a bailout and said the package announced amounted to sticking a finger into a leaking dam that was going to burst one way or another."
Jim Roger on Fannie & Freddie
LET'S GO IN PAST FOR A MOMENT & HEAR FROM x FED RESERVE CHAIRMAN GREENSPAN that "Excess money causes inflation."
He appeared on Daily Show in October of last year, but still it's worth looking @ how Fed is screwing up things. These are the points Greenspan is making.
1) Excess money causes inflation.
2) Fed easy credit favors stock market operators at the expense of savers.
3) The Fed believes that the market trades more on perception of what the Fed is or will do instead of the actual policies.
4) The Fed must make the market perceive that the system is sound.
5) The presence of the Fed guarantees there is no ‘free market’.
6) He still can’t forecast the economy or whether there is a bubble or too much exuberance.
- Source BigPicture
FNM × FRE × Money Supply × US Dollar
"The government-chartered companies, which own or guarantee about half the $12 trillion of U.S. mortgages, can count on a federal lifeline, said Republican Senator John McCain, of Arizona, and Democratic Senator Charles Schumer, of New York." - Bloomberg Report
Fannie Mae & Freddie Mac- too big to fail?
http://www.cnbc.com/id/25638740
It looks very confirmed that FNM & FRE will get Government Bail Out. It is gonna be really ugly, if that happens. US Government already has too much spending & unstoppable rapidly growing money supply and now about 5 Trillion Dollar bail out. Fed is gonna print more money to do that. Federal Reserve has already printed about 4 trillion in last three years. Once all those money go into circulation, too many dollars will decrease the purchasing power big time & inflation will kick in at faster rate. Lehman Brother is on it's way to become another Bear Sterns. Very few signs from Fed to raise rates by end of year. May be bottom will come faster than expected.
Money Supply

What is this MZM, M1, M2, M3? http://en.wikipedia.org/wiki/Money_supply
Consumer Price Index- Inflation Current Account Balance
Commercial Banks Credit In conclusion,
Federal Reserve Bank of St. Louis
Fannie Mae & Freddie Mac- too big to fail?
http://www.cnbc.com/id/25638740
It looks very confirmed that FNM & FRE will get Government Bail Out. It is gonna be really ugly, if that happens. US Government already has too much spending & unstoppable rapidly growing money supply and now about 5 Trillion Dollar bail out. Fed is gonna print more money to do that. Federal Reserve has already printed about 4 trillion in last three years. Once all those money go into circulation, too many dollars will decrease the purchasing power big time & inflation will kick in at faster rate. Lehman Brother is on it's way to become another Bear Sterns. Very few signs from Fed to raise rates by end of year. May be bottom will come faster than expected.
Money Supply

What is this MZM, M1, M2, M3? http://en.wikipedia.org/wiki/Money_supply
Consumer Price Index- Inflation
 Current Account Balance
Commercial Banks Credit
 In conclusion,
- Bad news for US Dollar, US Tax Payers & Global Equity Market.
- Good news for EUR, AUD, GOLD, JPY, CHF, SILVER, OIL.
Federal Reserve Bank of St. Louis
Dow Jones × Nikkei × SPX × USD/JPY
We are seeing in these two charts' analysis that Nikkei eventually meets USD/JPY. Currently correlation between these two is bit low, but eventually Nikkei will catch up with USD/JPY. So if we apply this correlation scenario with SPX vs. Nikkei vs. USD/JPY, I am seeing greenzone in SPX & Nikkei soon after correction to near 1200 on SPX. 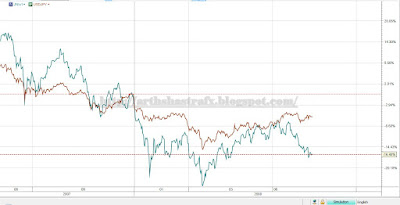

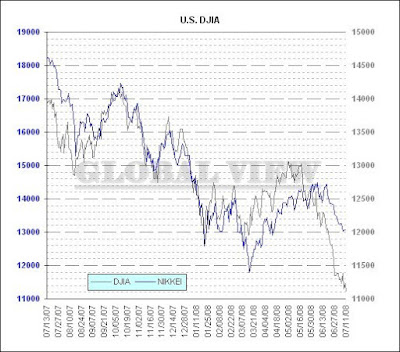 From technical level, USDJPY is ready to move ahead near 110, unless something serious fundamental event comes up.


 From technical level, USDJPY is ready to move ahead near 110, unless something serious fundamental event comes up.
SPX
Daily
 Weekly
 Monthly
 Weekly
 Monthly
SPX × US$ Index × USD/JPY × VIX
- USD/JPY is about to rise back to 108.30 level.
- VIX is about to fall to previous support level near 16.
- But SPX hasn't finished it's correction to near 1200(speaking from Trendline channel.)
- US $ Index is heading upward to 74 level which is bear for Crude & Gold.
- If you notice, currently there is a divergence going on between SPX & USD/JPY. Historical Correlation Ratio says that these two move in same direction between 80-90%, sometimes more than 90%.


